
As part of our Maths learning today, Year 2 have been learning all about Pictograms. When working with pictograms, we must pay attention to the key. The key represents the amount.
Pictograms show a set of data. This could be about a range of things, such as favourite colours, food, sports etc.
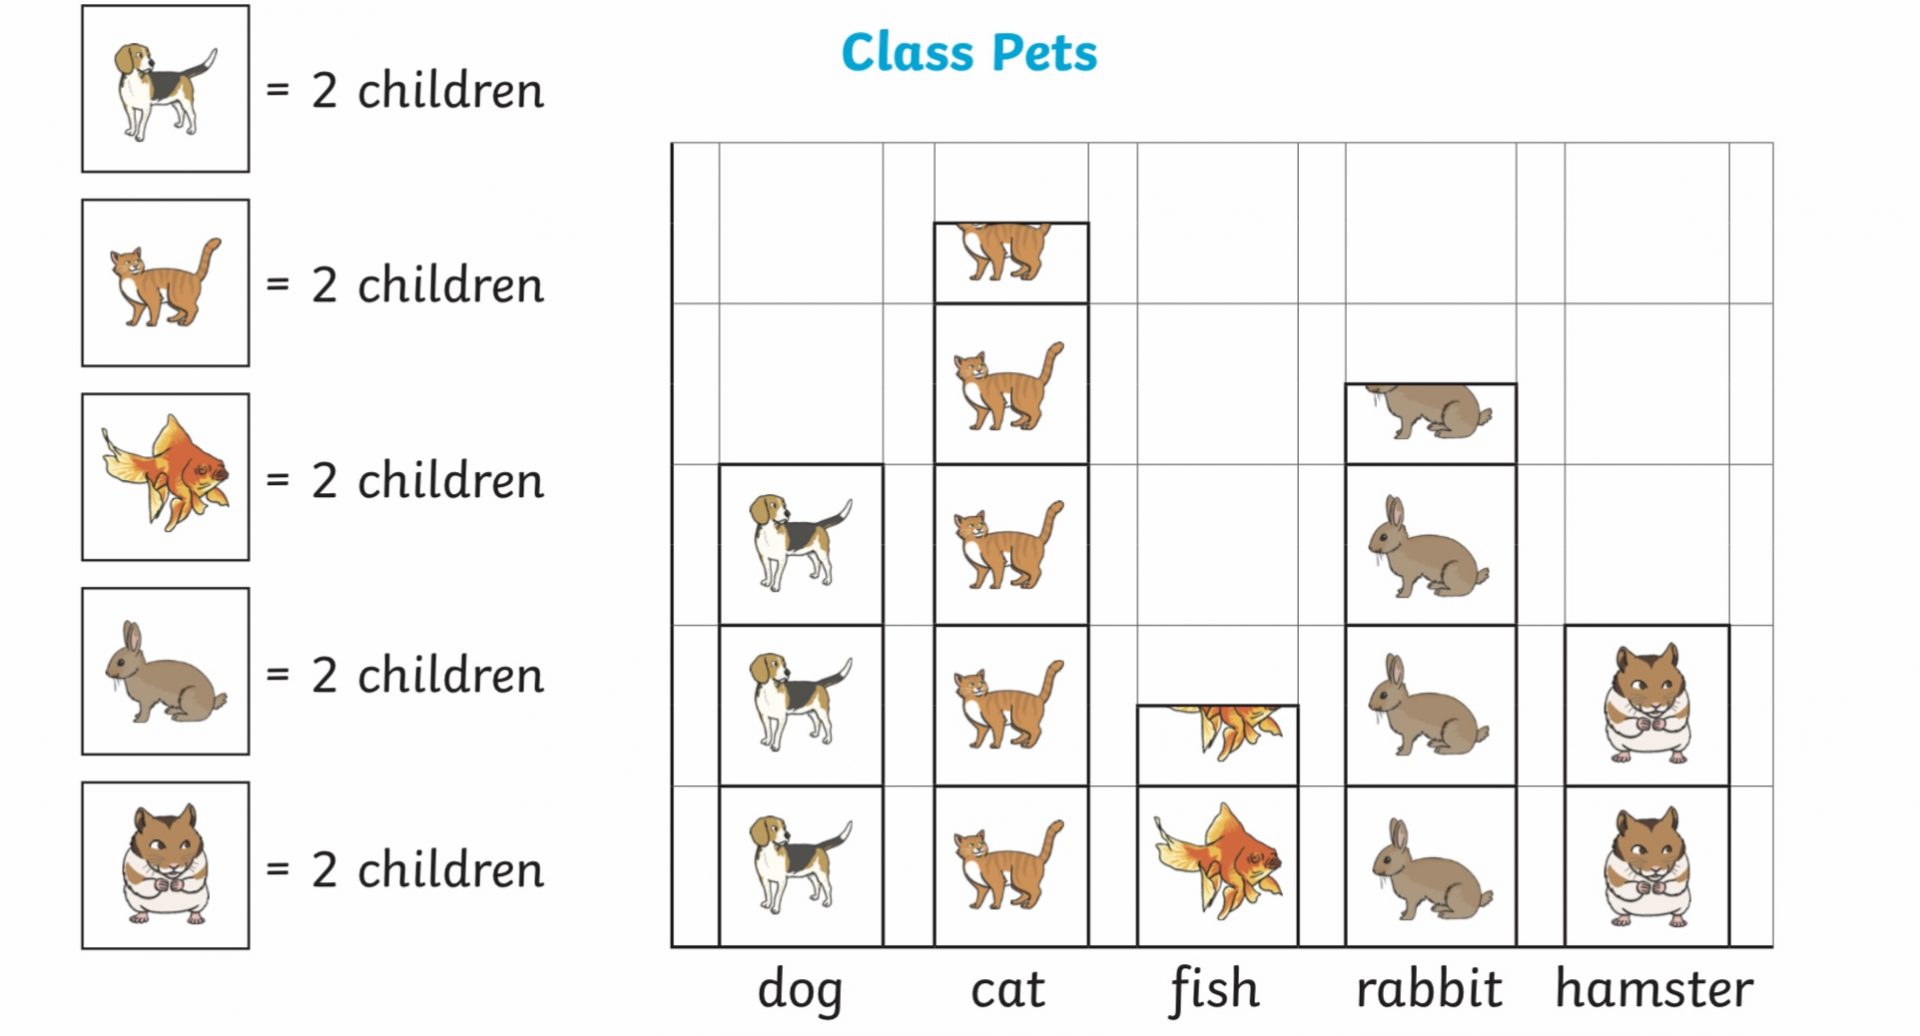
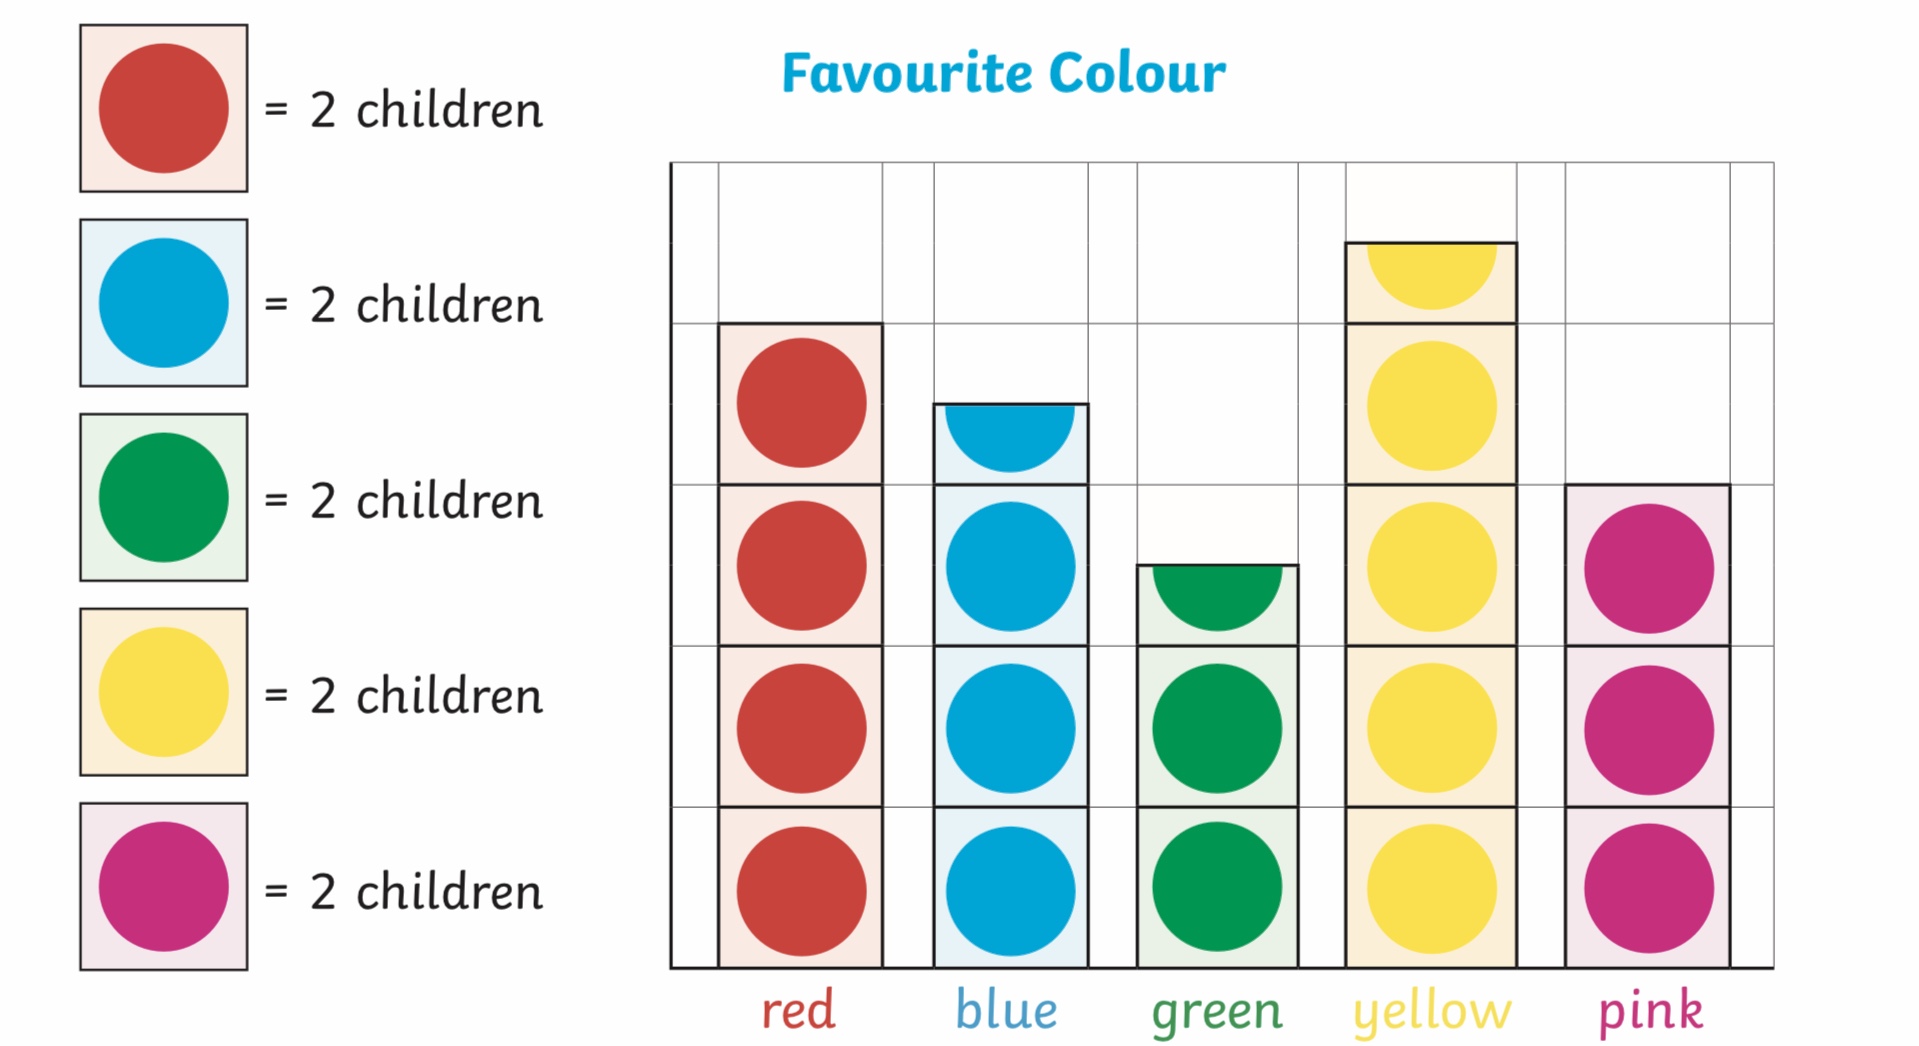
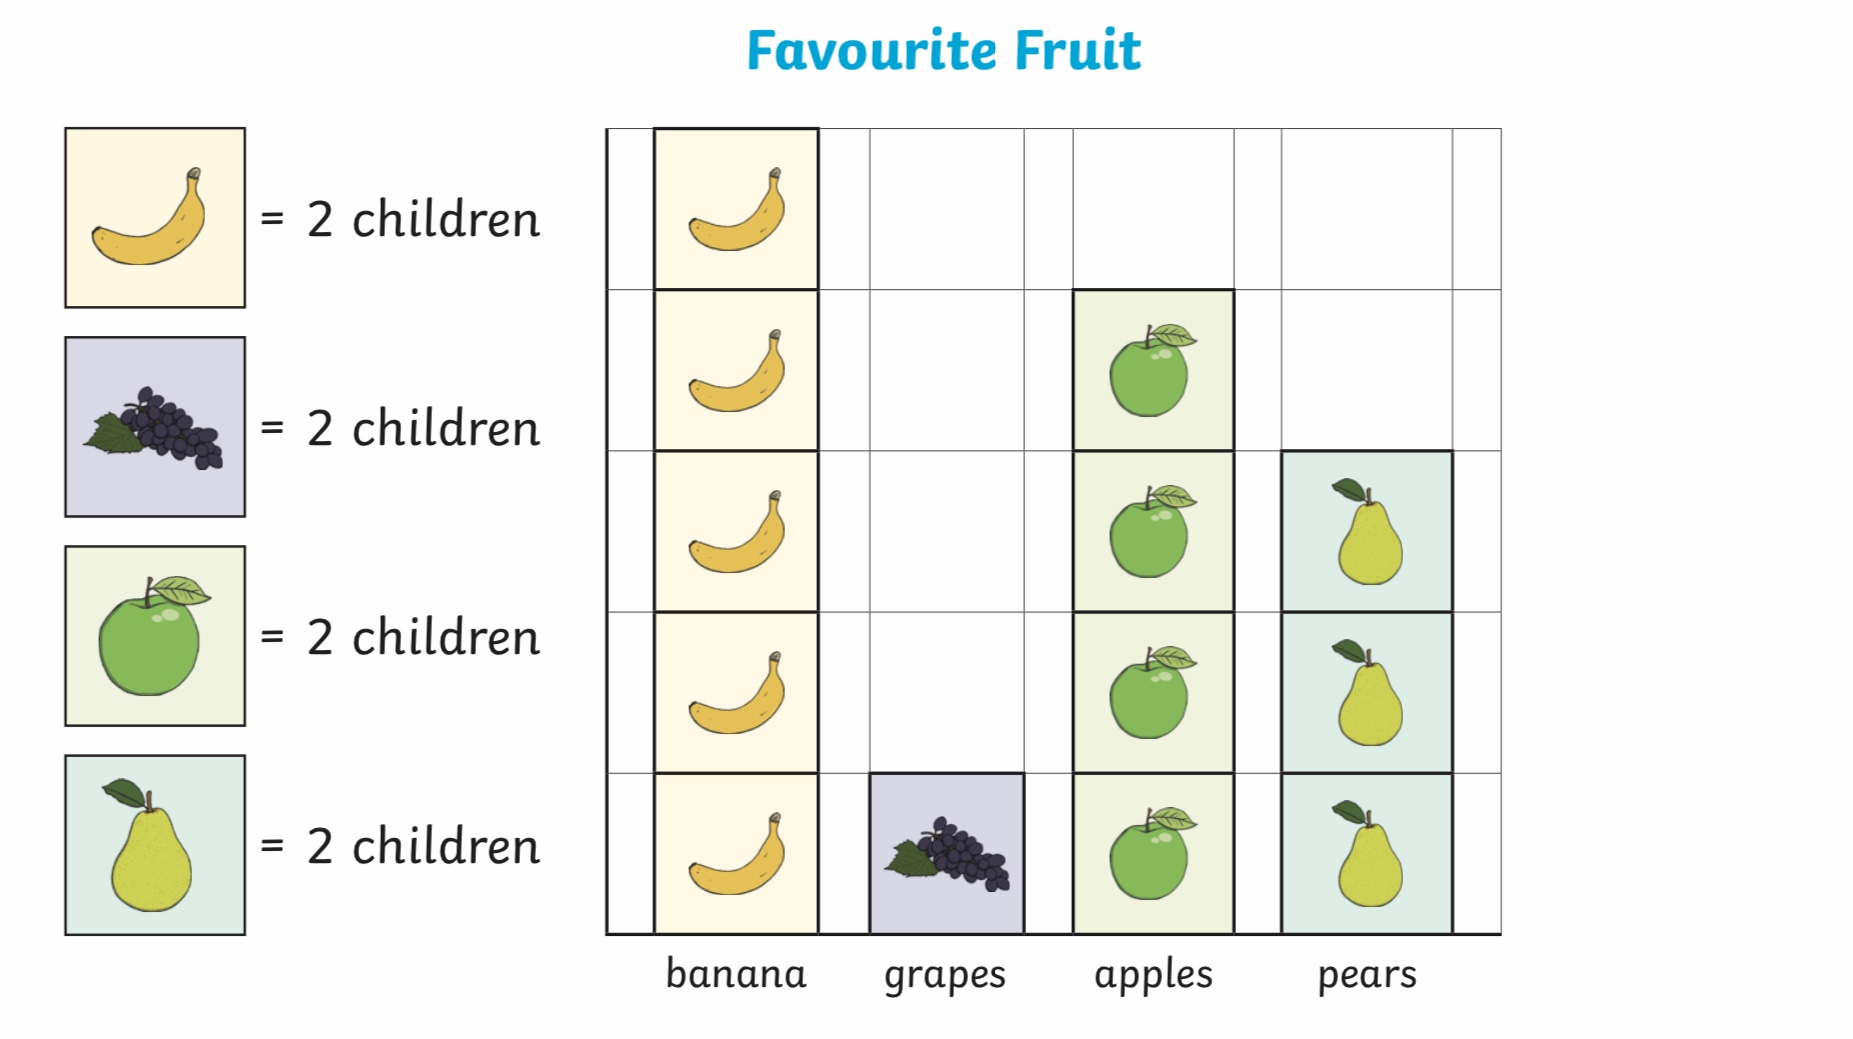
Look at the pictograms below. What data can you gather from looking at these pictograms?
How many children have a hamster as a pet?
How many children have a fish as a class pet?
How many more children have a rabbit as a class pet than a dog?
How many children chose yellow as their favourite colour?
How many children chose pink as their favourite colour?
Which colour was the least popular?
How many chose red as their favourite colour than green?
How many chose banana as their favourite fruit?
How many prefer apples over grapes?
Which fruit was the least popular?
Leave a Reply
You must be logged in to post a comment.